Note
This tutorial was generated from an IPython notebook that can be downloaded here.
Framework Cookbook
littlemcmc only needs a logp_dlogp_func, which is
framework-agnostic. To illustrate this, this cookbook implements linear
in multiple frameworks, and samples them with littlemcmc. At the end
of this notebook, we load the inference traces and sampler statistics
into ArviZ and do some basic visualizations.
import littlemcmc as lmc
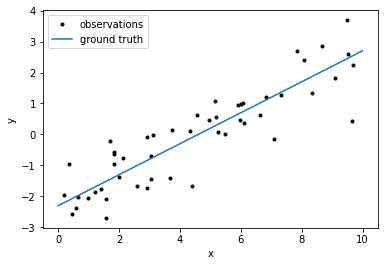
Create and Visualize Data
import numpy as np
import matplotlib.pyplot as plt

np.random.seed(42)

true_params = np.array([0.5, -2.3, -0.23])

N = 50
t = np.linspace(0, 10, 2)
x = np.random.uniform(0, 10, 50)
y = x * true_params[0] + true_params[1]
y_obs = y + np.exp(true_params[-1]) * np.random.randn(N)

plt.plot(x, y_obs, ".k", label="observations")
plt.plot(t, true_params[0]*t + true_params[1], label="ground truth")
plt.xlabel("x")
plt.ylabel("y")
plt.legend()
plt.show()
PyTorch
import torch

class LinearModel(torch.nn.Module):
    def __init__(self):
        super(LinearModel, self).__init__()
        self.m = torch.nn.Parameter(torch.tensor(0.0, dtype=torch.float64))
        self.b = torch.nn.Parameter(torch.tensor(0.0, dtype=torch.float64))
        self.logs = torch.nn.Parameter(torch.tensor(0.0, dtype=torch.float64))

    def forward(self, x, y):
        mean = self.m * x + self.b
        loglike = -0.5 * torch.sum((y - mean) ** 2 * torch.exp(-2 * self.logs) + 2 * self.logs)
        return loglike

torch_model = torch.jit.script(LinearModel())
torch_params = [torch_model.m, torch_model.b, torch_model.logs]
args = [torch.tensor(x, dtype=torch.double), torch.tensor(y_obs, dtype=torch.double)]

def torch_logp_dlogp_func(x):
    for i, p in enumerate(torch_params):
        p.data = torch.tensor(x[i])
        if p.grad is not None:
            p.grad.detach_()
            p.grad.zero_()

    result = torch_model(*args)
    result.backward()

    return result.detach().numpy(), np.array([p.grad.numpy() for p in torch_params])
298 µs ± 43.8 µs per loop (mean ± std. dev. of 7 runs, 1000 loops each)
Please see
`sample_pytorch_logp_dlogp_func.py <https://github.com/eigenfoo/littlemcmc/tree/master/docs/_static/scripts/sample_pytorch_logp_dlogp_func.py>`__
for a working example. Theoretically, however, all that’s needed is to
run the following snippet:
trace, stats = lmc.sample(
    logp_dlogp_func=torch_logp_dlogp_func, model_ndim=3, tune=500, draws=1000, chains=4,
)
JAX
from jax.config import config
config.update("jax_enable_x64", True)

import jax
import jax.numpy as jnp

def jax_model(params):
    mean = params[0] * x + params[1]
    loglike = -0.5 * jnp.sum((y_obs - mean) ** 2 * jnp.exp(-2 * params[2]) + 2 * params[2])
    return loglike

@jax.jit
def jax_model_and_grad(x):
    return jax_model(x), jax.grad(jax_model)(x)


def jax_logp_dlogp_func(x):
    v, g = jax_model_and_grad(x)
    return np.asarray(v), np.asarray(g)
/Users/george/miniconda3/lib/python3.7/site-packages/jax/lib/xla_bridge.py:125: UserWarning: No GPU/TPU found, falling back to CPU.
  warnings.warn('No GPU/TPU found, falling back to CPU.')
269 µs ± 48.6 µs per loop (mean ± std. dev. of 7 runs, 1 loop each)
Please see
`sample_jax_logp_dlogp_func.py <https://github.com/eigenfoo/littlemcmc/tree/master/docs/_static/scripts/sample_jax_logp_dlogp_func.py>`__
for a working example. Theoretically, however, all that’s needed is to
run the following snippet:
trace, stats = lmc.sample(
    logp_dlogp_func=jax_logp_dlogp_func, model_ndim=3, tune=500, draws=1000, chains=4,
)
PyMC3
import pymc3 as pm
import theano

with pm.Model() as pm_model:
    pm_params = pm.Flat("pm_params", shape=3)
    mean = pm_params[0] * x + pm_params[1]
    pm.Normal("obs", mu=mean, sigma=pm.math.exp(pm_params[2]), observed=y_obs)

pm_model_and_grad = pm_model.fastfn([pm_model.logpt] + theano.grad(pm_model.logpt, pm_model.vars))

def pm_logp_dlogp_func(x):
    return pm_model_and_grad(pm_model.bijection.rmap(x))
46.3 µs ± 3.94 µs per loop (mean ± std. dev. of 7 runs, 10000 loops each)
trace, stats = lmc.sample(
    logp_dlogp_func=pm_logp_dlogp_func,
    model_ndim=3,
    tune=500,
    draws=1000,
    chains=4,
    progressbar=False,  # Progress bars don't render well in reStructuredText docs...
)
Visualize Traces with ArviZ
Just to sanity check our results, let’s visualize all the traces using
ArviZ. At the time of writing there’s no way to easily load the
np.ndarrays arrays that littlemcmc returns into an
az.InferenceDataset. Hopefully one day we’ll have an
az.from_littlemcmc method… but until then, please use this code
snippet!
def arviz_from_littlemcmc(trace, stats):
    return az.InferenceData(
        posterior=az.dict_to_dataset({"x": trace}),
        sample_stats=az.dict_to_dataset({k: v.squeeze() for k, v in stats.items()})
    )
import arviz as az

dataset = arviz_from_littlemcmc(trace, stats)

az.plot_trace(dataset)
plt.show()